
Can't Hide in 3D

In a sea of millions of security events, one workstation literally stood out, floating high above all the others when I transformed flat logs into a 3D visualization. I wasn't hunting for it. I didn't filter for it. It emerged naturally.
Every SOC faces the same paradox: drowning in millions of events while blind to the patterns within them. Let's go back in time to examine a classic dataset. The BOTS v2 dataset encompasses 100 different data sources, generating an endless stream of logs. Traditional detection looks for known bad things: specific artifacts, IOCs (Indicators of Compromise), correlation rules. But what about the unknown unknowns?
In the BOTS v2 scenario, the attacker:
Used legitimate credentials
Performed actions that individually looked normal
Blended with regular traffic
Still, it compromised the entire environment
No single rule would catch this. But the attacker's overall pattern (touching many systems, active at unusual times, performing diverse actions) was completely abnormal.
The question is: how do you find workstations behaving unusually when you don't know what "unusual" looks like?
The answer: transform your security data into a 3D landscape where behavior becomes terrain.
Imagine each workstation in your network as a person in a city. Normal workstations are like commuters. They follow predictable patterns at predictable times, doing routine tasks. Compromised workstations are like tourists. They wander around, visiting different locations, and are active at odd hours, engaging in various activities they shouldn't be doing.
In 3D space, I measure:
How many different security tools observe their activity (terrain diversity)
How many different time periods they're active (temporal diversity)
How many different actions they perform (behavioral diversity)
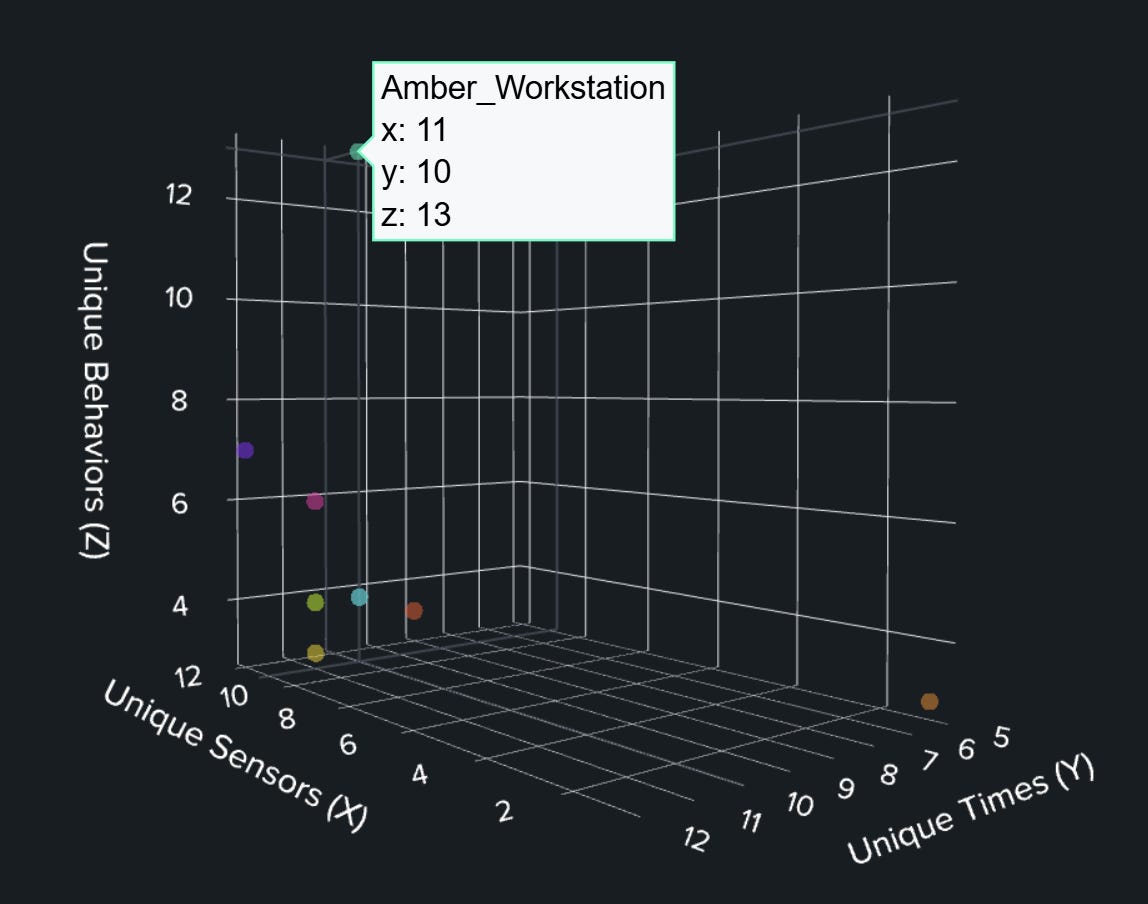
Normal workstations cluster together near the origin, exhibiting low diversity across all dimensions. But when I applied this approach to the BOTS v2 dataset, one workstation became a clear outlier. It was observed that 11 different security tool categories (vs. 3-5 normal) were active across 12 different time contexts (vs. 4-6 normal), and they performed 13 or more different behavior types (vs. 4-7 normal).
I found Amber's workstation without targeting it, without filtering for it, without knowing to look for it. The unusual pattern revealed itself.

From Theory to Practice: The TTB Framework Evolution
The Time-Terrain-Behavior (TTB) framework isn't new. It's been gaining traction in the security community for years:
MITRE introduced TTB in their "TTP-Based Hunting" paper (2019), defining the three critical dimensions for understanding threat actor movement
MITRE's "11 Strategies for a World-Class SOC" (2022) continued to recommend TTB as a core visualization approach
The MAD20 Course (2024) provided academic validation of the TTB model for advanced threat hunting.
The Splunk Threat Hunter's Cookbook (2025) introduced 3D scatter plots as a visualization tool that threat hunters should have in their toolbox.
While the framework is well-established, most implementations remain theoretical. Today, I'm bridging theory and practice by operationalizing TTB against a real-world dataset.
Why I'm Using the BOTS v2 Dataset
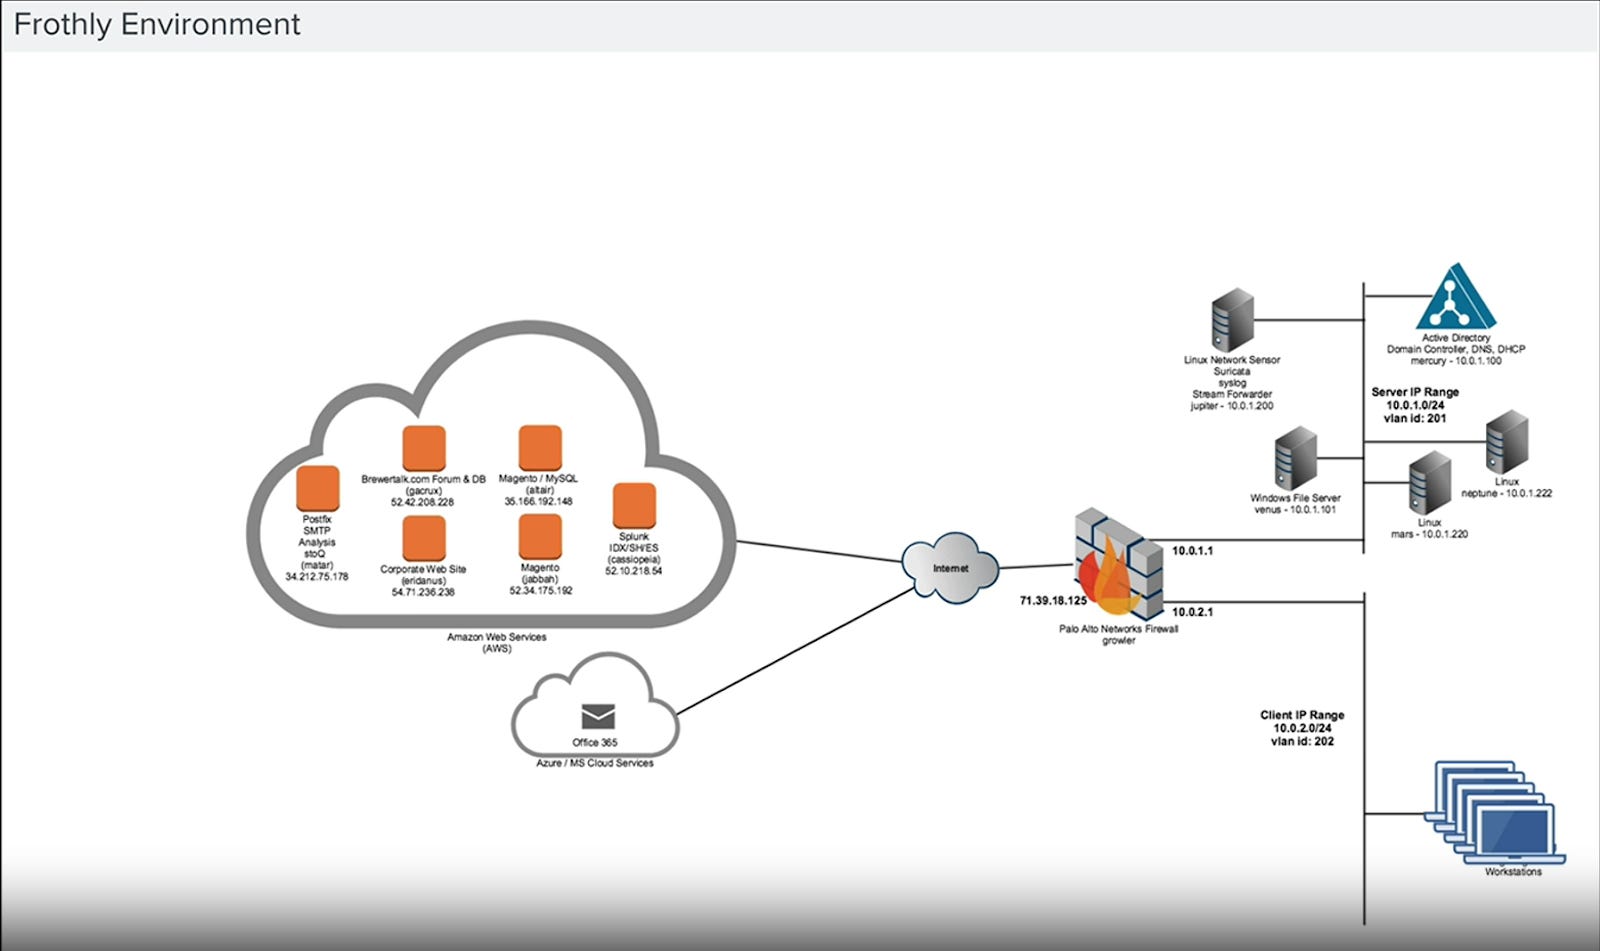
Security practitioners need controlled environments to validate new detection methods. The Splunk Boss of the SOC v2 (BOTS v2) dataset from the fictional Frothly brewing company provides an ideal testing ground because:
Known Ground Truth: The dataset contains documented compromises, allowing validation of whether this approach would detect them in the wild
Complete Timeline: With a whole month of data, I can test if the approach works across extended time periods
Realistic Complexity: The dataset comprises 71 million events across 100 source types. I focused my analysis on client workstations
Community Standard: As a widely used dataset, results can be compared with other detection approaches
My goal is to prove that TTB visualization can identify unusual behavior patterns without prior knowledge of what to look for, thereby demonstrating its value for real-world threat hunting where attackers techniques are unknown.
The 3D Approach: Visualizing Behavior Patterns
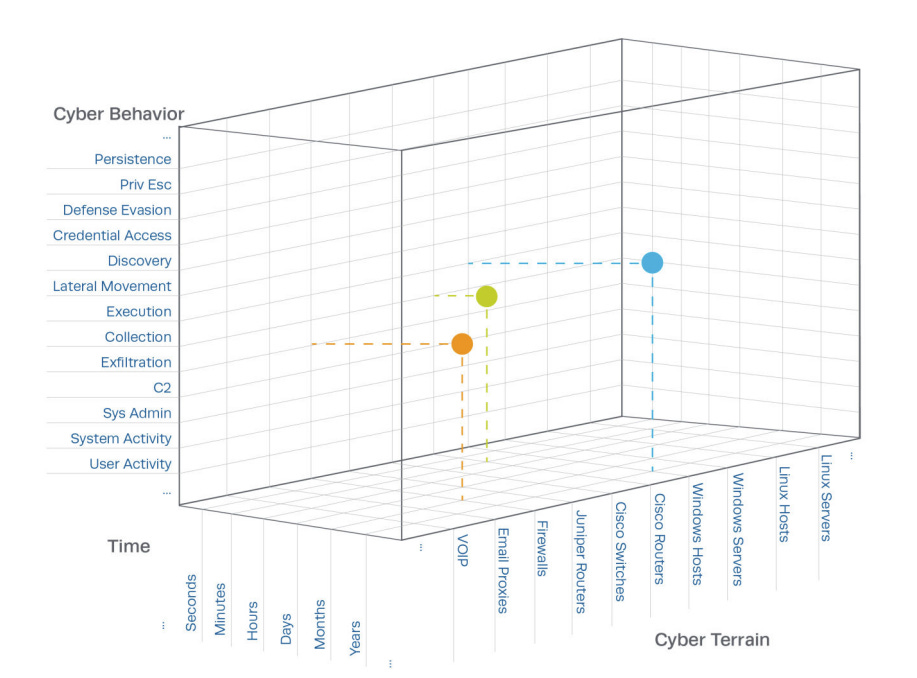
The TTB model creates a 3D space where:
X-axis (Terrain): Shows how many different security tools observe a workstation's activity
Normal workstations appear in a few logs (low value), mostly their local system logs
Compromised workstations appear everywhere (high value), triggering multiple security tools and sensors
Y-axis (Time): Reveals when workstations are active
Normal workstations operate during predictable hours (low value), standard business hours
Compromised workstations operate at odd times (high value), are active on weekends, holidays, and in the middle of the night
Z-axis (Behavior): Displays the diversity of actions performed
Normal workstations perform repetitive, similar tasks (low value), mostly browsing, emailing, and accessing duplicate files
Compromised workstations do many different things (high value), such as logging in, changing settings, downloading, and deleting
In this space, regular workstations naturally cluster together near the origin (low values on all axes), while compromised workstations appear as outliers, dots floating far away from the central cluster.
My Testing Methodology: The No-Cheating Approach
For TTB to be useful in real environments, it must detect unusual behavior without prior knowledge of what to look for. My testing approach ensures this through five principles:
I analyzed the whole 30-day time period, not just specific timeframes
I included multiple data sources across the environment, not just security-relevant ones
I didn't filter for known indicators of compromise
I created generic behavioral categories that apply to any environment
I let clustering happen naturally in 3D space without biasing the model
This approach mirrors how you'd apply TTB in your own environment, where you don't know in advance which workstations might be compromised or what techniques attackers might use.
Implementing TTB: A 5-Step Process
Here's how to implement the TTB approach using the Frothly environment as my example:
Step 1: Understanding the TTB Dimensions
The Time-Terrain-Behavior model transforms how we visualize security data by measuring activity across three critical dimensions:
🕒 Time (Y-Axis): When Activity Occurs
Transform raw timestamps into business context. Instead of "3:00 AM," think "After-hours activity by a workstation that normally operates 9-5." This contextual approach reveals temporal anomalies that raw timestamps hide.
🗺️ Terrain (X-Axis): Where Evidence Appears
Map the diversity of security tools and data sources that observe a workstation's activity. A workstation appearing in logs from 10 different security tools is fundamentally different from one that only appears in its local Windows event logs. This dimension reveals workstations whose activity spreads across your entire security stack.
🎯 Behavior (Z-Axis): What Actions Are Observed
Measure the variety of actions, not just their volume. A workstation performing many different types of actions (login, configuration changes, file access, command execution) shows higher behavioral complexity than one performing repetitive tasks.
The Critical Transformation: From Categories to Coordinates
While the MITRE TTB diagram shows categorical labels on each axis, 3D visualization tools need numbers to plot points in space. This is why I transform categorical data into quantitative metrics:
Categorical Time (Morning, Evening, Weekend) becomes Numerical Y-value (count of distinct time contexts)
Categorical Terrain (Windows, Network, Cloud) becomes Numerical X-value (count of distinct terrain types)
Categorical Behavior (Authentication, Execution, Access) becomes Numerical Z-value (count of distinct behaviors)
This transformation is the secret sauce that makes TTB visualization practical in real environments.
Choosing Your Focus: Workstations as the Unit of Analysis
Before implementing TTB, I had to decide what to monitor. In any environment, you have multiple options:
Individual Users: Track by username across all systems
Workstations: Track specific endpoints (my choice)
Departments: Group by business unit
Network Segments: Group by network location
For my Frothly implementation, I focused on individual workstations (10 specific client machines) because:
Workstations represent the human-operated endpoints most likely to show diverse behavior
They provide a manageable number of entities for clear visualization
They span different departments and user roles
Compromised workstations are often the starting point for attacks
Practical Tip: Limit your visualization to 7-12 entities maximum for visual clarity. Too many dots in your 3D space will make pattern identification difficult. If you have hundreds of systems, create logical groupings based on your environment's structure and threat model.
Step 2: Transform Time into Business Context
The first step in implementing TTB is transforming raw timestamps into a meaningful business context that reveals temporal anomalies.

What this achieves: Converting raw timestamps into 15 distinct business contexts gives you much greater temporal resolution than simple "business hours" vs "after hours" categorization. Now you can measure the number of different time contexts in which each workstation operates.
Step 3: Map Terrain Categories for Data Sources
Next, categorize your data sources into logical terrain types. This lets you see where evidence of workstation activity appears across your security stack.
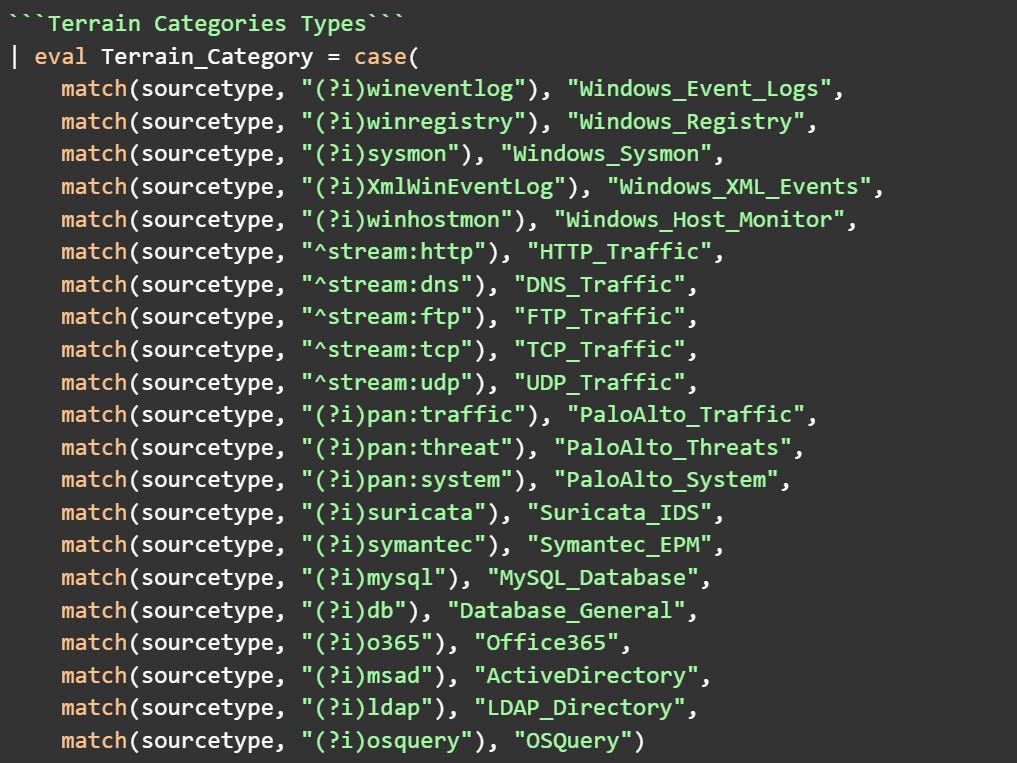
What this achieves: This categorization creates logical groups for your security tools and data sources. You can now see which types of monitoring systems are observing each workstation's activities. Normal workstations primarily appear in their local logs. Compromised workstations trigger alerts across multiple security tools.
Hunt tip: Include ALL data sources, not just security-focused ones. This ensures you have a complete picture of workstation behavior and helps unusual patterns emerge naturally.
Step 4: Classify Behavioral Patterns
The behavior dimension captures what actions workstations are performing. By classifying behaviors, you can measure the diversity of behaviors.
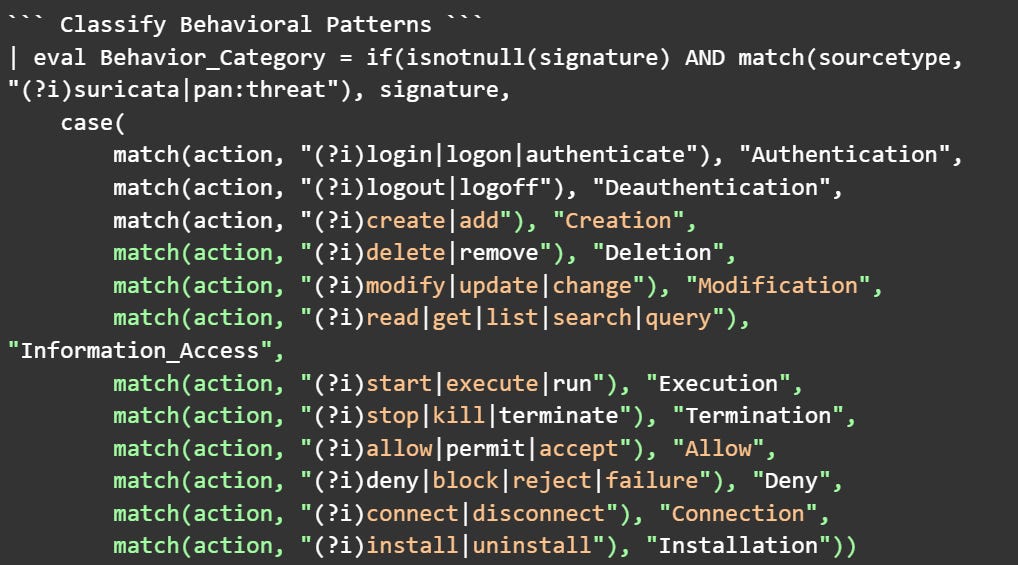
What this achieves: This taxonomy captures behavioral patterns using generic action categories that apply to any environment. When IDS/IPS signatures are present, I treat each unique signature as a distinct behavior type. Not because they're "bad," but because they represent genuinely different observed activities. I'm not weighting or targeting specific attacks; I'm simply measuring how many other types of actions a workstation performs.
Step 5: Create Consistent Entity Mapping
Before calculating diversity metrics, I need to ensure consistent workstation identification across all data sources. A single workstation might appear as a hostname in Windows logs and as an IP address in network traffic. The IP address is just a lower layer of abstraction for the host, so I need to unify these identities.
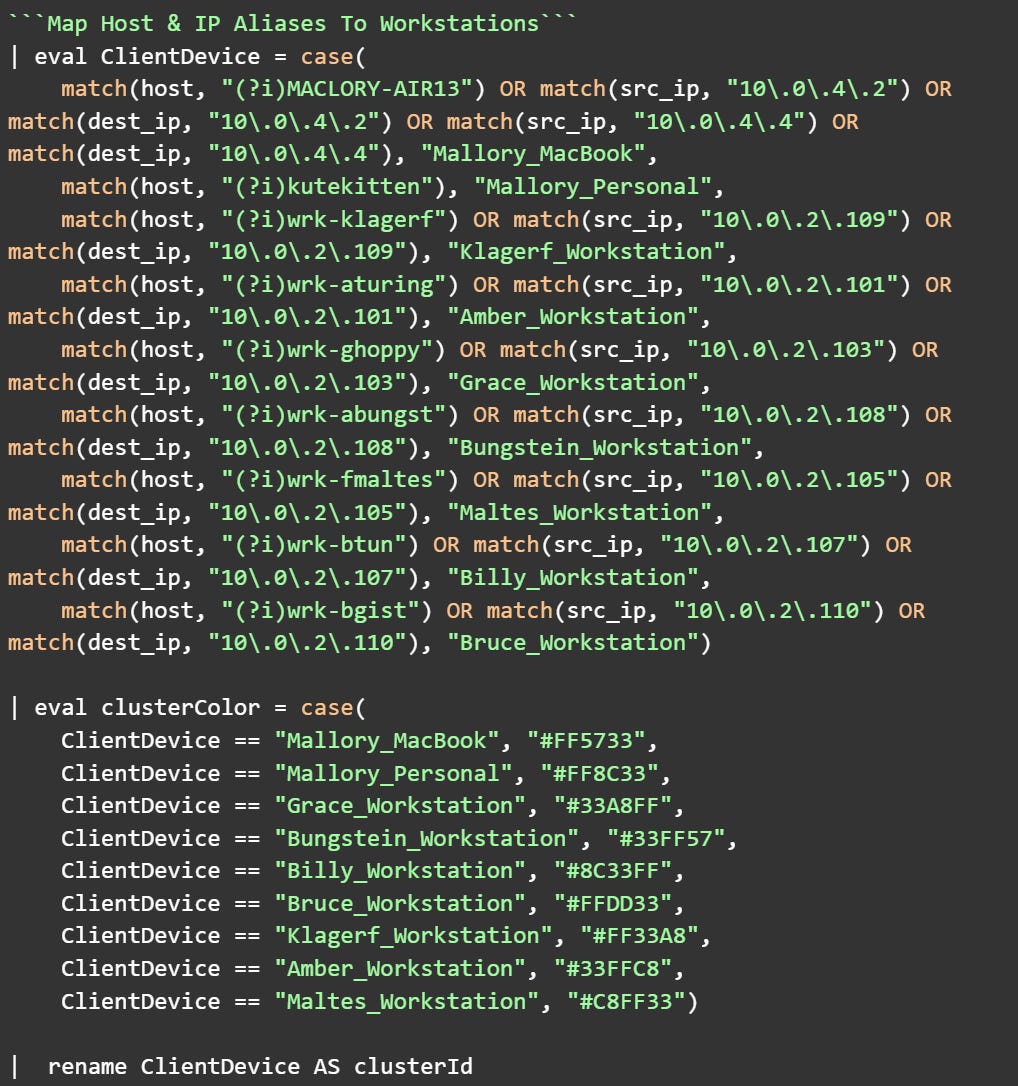
What this achieves: This creates unified workstation tracking across all data sources, critical for accurate diversity measurement. A workstation appearing as both a hostname and an IP address is mapped to a single identity, preventing artificial inflation of diversity scores. The color assignments ensure visual distinction in 3D space, while the field rename meets the visualization's parameter requirements.
Step 6: Calculate TTB Dimensions
Now for the final transformation: converting millions of events into three simple diversity scores per workstation. This is where the magic happens. All that complex data collapses into coordinates that instantly reveal patterns.
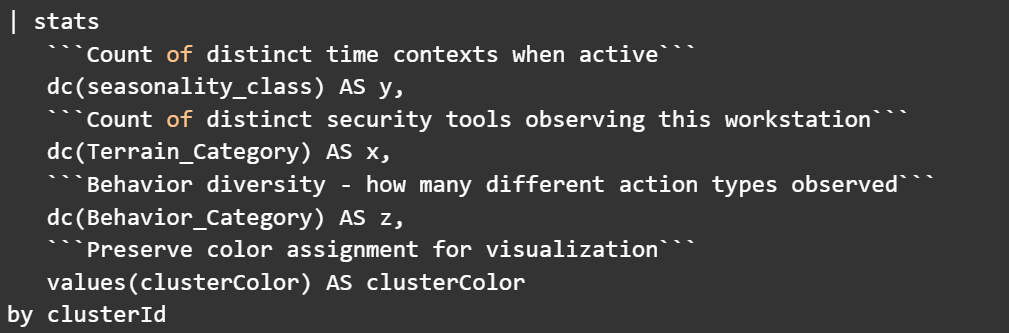
What this achieves: This calculates three diversity scores for each Frothly workstation:
Y (Time Diversity): How many different time contexts each workstation is active in
X (Terrain Diversity): How many different security tool categories are observed at each workstation
Z (Behavior Diversity): How diverse each workstation's behaviors are
By measuring diversity rather than volume, I detect patterns that would be hidden in traditional analysis. In the Frothly dataset, Amber's workstation stands out as a significant outlier, exhibiting unusually high diversity across all dimensions.
The Pivot: What I Found About Amber
After TTB identified Amber's workstation as the primary outlier, I investigated further. Here's what the data revealed:
The Profile:
Job Title: Principal Scientist at Frothly
Status: Disgruntled employee after failed Berkbeer acquisition
Actions: Reached out to Berkbeer executives, offering to share proprietary information
Evidence: Emails to Martin Berk (CEO) and Bernhard expressing concerns about her future
The Behavioral Signatures That TTB Detected:
Looking at the actual behaviors that created Amber's outlier status:
104,255 events for her workstation (vs. 20-90k for normal workstations)
Multiple TOR relay node connections
Port scanning activity (ET SCAN Behavioral Unusual Port 445)
Policy violations (TLS possible TOR SSL traffic)
Diverse legitimate actions mixed with suspicious ones
The beauty of TTB? I didn't search for "disgruntled employee" or "data exfiltration" patterns. I measured behavioral diversity, and Amber's insider threat activity naturally emerged as a spatial outlier. Her attempts to gather information across multiple systems, work at unusual hours, and perform varied collection activities created the exact diversity signature that TTB visualizes.
This validates the core principle: unusual patterns are challenging to hide in 3D space.
Why This Approach Works: Key Principles for Success
The TTB visualization approach transforms how we identify unusual behavior by measuring diversity across three dimensions, making patterns visually obvious without complex rules.
5 Critical Success Factors
No Cherry-Picking: Don't filter for specific workstations or patterns. Let the data speak for itself
Let Patterns Emerge: Use the visualization to find natural clusters and outliers
Normalize Scales: Use statistical normalization for balanced dimensions if needed
Include All Data: Process all data sources, not just security-focused ones
Apply Minimal Bias: Use generic categories that don't target specific attack patterns
The Takeaway: Dimensional Thinking Reveals Hidden Patterns
Traditional security analytics focus on known patterns and individual events. The TTB approach revolutionizes this by measuring diversity across time, terrain, and behavior dimensions, creating a 3D visualization where unusual patterns naturally stand out.
By transforming categorical security data into a three-dimensional space, you can instantly answer the most critical question in security: "Which workstations are behaving unusually compared to everything else?"
References & Resources
Code Repository
TTB Framework Evolution
BOTS v2 Dataset
Technical Implementation
 | A guest post by
|
This is incredible. I've done some meta-scoring style stuff before:
https://splunk.github.io/rba/searches/risk_incident_rule_ideas/#events-from-multiple-sourcetypes
but I *love* the idea of giving labels to other things to dc() on for more dimensionality. Definitely going to build on this! Thank you. ✨