
Because Logs Don’t Hunt Themselves - A Deep Dive into tstats
SPL Dispatch #1 - 04/08/2025

🚨 New series alert 🚨
Ever found yourself staring at a slow Splunk search, questioning all your life choices? Wondering if there’s a better, faster way to get the data you need?
Same. 🙋🏻♀️

That’s why we’re kicking off SPL (Splunk Processing Language) Dispatch. A short, to the point breakdown of one Splunk command, why it’s useful, and how you can use it for thrunting.
One command and what it does
When to use it
Practical example
🎯 First up: tstats
Never heard of it? Well, you’re in luck.
What It Does
tstats pulls event data straight from already indexed fields instead of raw events, making it much faster for working with large datasets. Think of it as using stats in the first step of the analysis to speed up your counting, aggregating, and filtering of a data source.
What is Indexed Data?
When Splunk ingests data, it automatically indexes some fields, like:
_time– Because knowing when something happened is kinda important.index– Where your data lives.sourcetype,source,host– The basics for tracking your data source.
tstats can only use fields that Splunk indexes at ingestion, like _time, index, host, and sourcetype. If a field isn’t indexed (like EventCode or TargetUserName), tstats won’t see it unless you use data model acceleration.
To check if a field is indexed, run the query below and see if you get results:
| tstats values(fieldname) where index=indexnameWhat indexed results look like:
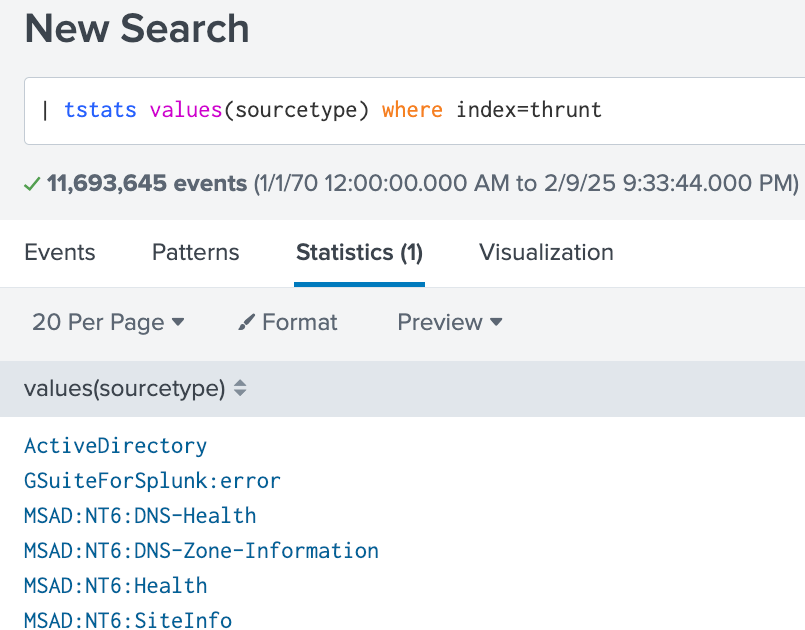
If you get no results, your field is NOT indexed.
Non-indexed fields won't work with tstats unless you use Data Models or configure extractions at index-time.
tldr
Your standard search scans every log event, taking time to process.
index=thrunt sourcetype=XmlWinEventLog
| stats count BY host 
tstats skips raw logs and only works directly with indexed metadata, making search SIGNIFICANTLY faster.
| tstats count WHERE index=thrunt sourcetype=XmlWinEventLog BY host 
For small searches, this isn’t a big deal. But when you’re filtering through massive amounts of events, those seconds add up!

When to Use It
Need to pull quick summary stats across large datasets? tstats can get you the results faster.
Do you have so much data that your searches are slloowww 🐢? Switch to tstats to optimize performance.
Similar to stats but only for indexed data.
Ideal for baselining. Great for establishing what “normal” looks like in your environment by quickly pulling metrics with tstats.
Example Hunt Query
You need to count events per host every hour and visualize trends over time.
| tstats count WHERE index=thrunt sourcetype=XmlWinEventLog BY _time, host span=1h
| timechart span=1h sum(count) BY host
Pro Tips
🔹 Indexed fields = Preprocessed, fast, and usable in tstats.
🔹 Regular fields = Found at search time, slow, and NOT usable in tstats unless accelerated.
🔹 If tstats ignores your field, it’s NOT indexed.
If you want tstats to work with non-indexed fields, consider creating a data model with acceleration enabled. This pre-processes the data, making non-indexed fields accessible at near-tstats speeds!
Until Next Time
That’s a wrap for our first SPL Dispatch! 🚀
If you’ve ever struggled with slow searches, tstats should now be in your thrunting toolkit. By pulling from indexed data instead of raw events, it makes Splunk searches significantly faster. Perfect for baselining, anomaly detection, and investigations with large amounts of data to filter through.
Useful Resources
🔥 What Next?
That’s the first post for the SPL Dispatch series. What do you think? Share your favorite (or least favorite) command in the comments!
Happy thrunting!
Great post! It's applicable and encourage additional exploration.