
Z-Scoring Your Way to Better Threat Detection
“Normal” is just a setting on a dryer. Let’s talk about what’s actually weird in your data.

Why Should You Care?
Remember that five-number summary you mastered like a math magician? It’s great for static datasets. But what if “normal” changes throughout the day? That’s where standard deviation and Z-scores shine since they adapt, flagging anomalies without constant tuning.

YIKES!
Standard Deviation: How Wild Is Your Data?
Standard deviation shows how spread out your data is around the average.
Low standard deviation: Everything’s chill and consistent.
High standard deviation: Absolulte CHAOS.
Think of it as measuring how “typical” your environment feels.
Z-Score: How Weird Is This?
Z-scores measure how far a data point is from the average.
0 to ±1? Normal
±1 to ±2? Slightly unusual, worth noting
±2 to ±3? SUS, investigate further
±3 or more? Highly anomalous, strong signal for malware
Translation: If your hourly notepad.exe runs have a Z-score of +4, someone’s either copy/pasting the next popular smut novel…or running malware.
But how sus is sus? Make sure you take into account the context when investigating these scores(e.g., a Z-score spike might be normal during patch Tuesday mass reboots).
Splunk Queries: Standard Deviation and Z-Score in Action
Use Case 1: Notepad.exe Process Executions (Like Before, But Smarter)
Remember our old friend, notepad.exe? This time, we’ll check for unusual activity using both standard deviation and z-scores.
Step 1: Standard Deviation to Find Abnormal Execution Counts
index=thrunt sourcetype=XmlWinEventLog EventCode=4688 Process_Name=notepad.exe

| bucket _time span=1h

| stats count as executions by _time

| eventstats avg(executions) as mean stdev(executions) as stdev

| eval lower_limit = mean - (2 * stdev), upper_limit = mean + (2 * stdev)

| where executions < lower_limit OR executions > upper_limit
What this does:
Buckets notepad.exe runs into 1-hour intervals.
Calculates average and standard deviation of executions per hour.
Flags hours with execution counts beyond 2 standard deviations from the mean.
Example output:


What this tells us:
2 executions? Oddly quiet (maybe everyone is napping)
22 executions? 🚩 They’re writing that novel! Or…running something sus.


Step 2: Z-Score for Precision Outlier Detection
Let’s add some z-score to the mix to amp up this query.
index=thrunt sourcetype=XmlWinEventLog EventCode=4688 Process_Name=notepad.exe

| bucket _time span=1h

| stats count as executions by _time

| eventstats avg(executions) as mean stdev(executions) as stdev

| eval lower_limit = mean - (2 * stdev), upper_limit = mean + (2 * stdev)

| eval z_score = (executions - mean) / stdev

| table _time executions mean stdev lower_limit upper_limit z_score
What this does:
Same bucketing and counting as before.
Calculates how many standard deviations each count deviates from the mean.
Flags anything with a Z-score above 3 or below -3 (because that’s 99.7% of “normal”).
Quick Refresher: The Empirical Rule (aka Why ±3 Matters)
68% of data falls within ±1 standard deviation
95% falls within ±2 standard deviations
99.7% falls within ±3 standard deviations
That’s why a Z-score beyond +3 or -3 is a huge red flag. Check here for the full stats, which are heavy on the details.
Example output:


What this tells us:
Z-score of +4? Eeek. That’s way outside the norm. Investigate ASAP.
Use Case 2: Failed Logins—Brute Force or Just Me Mistyping My Password?
Brute-force attacks often show up as a flood of failed logins. Let’s use z-scores to differentiate between a user forgetting their password and a brute force attack from a bad bot.
index=thrunt sourcetype=linux_secure action=failure

| bucket _time span=1h

| stats count as failed_logins by _time

| eventstats avg(failed_logins) as mean stdev(failed_logins) as stdev

| eval z_score = (failed_logins - mean) / stdev
Example output:
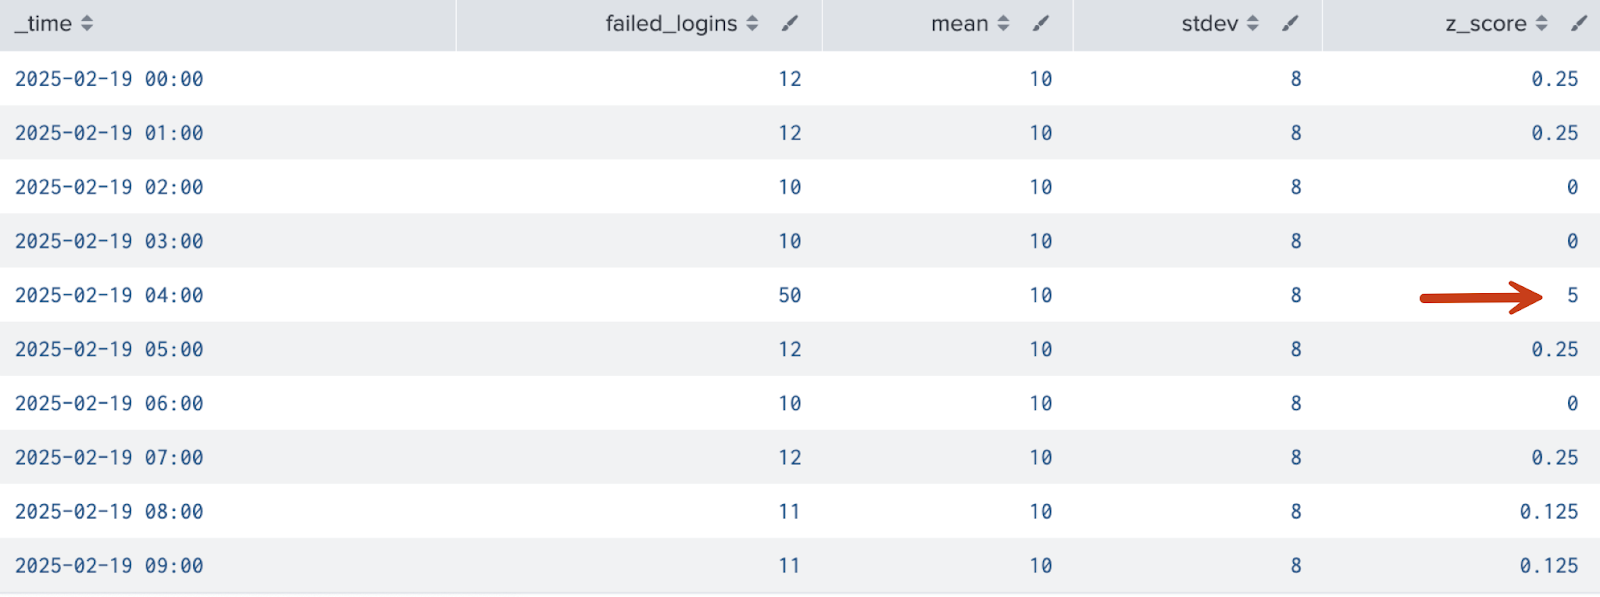
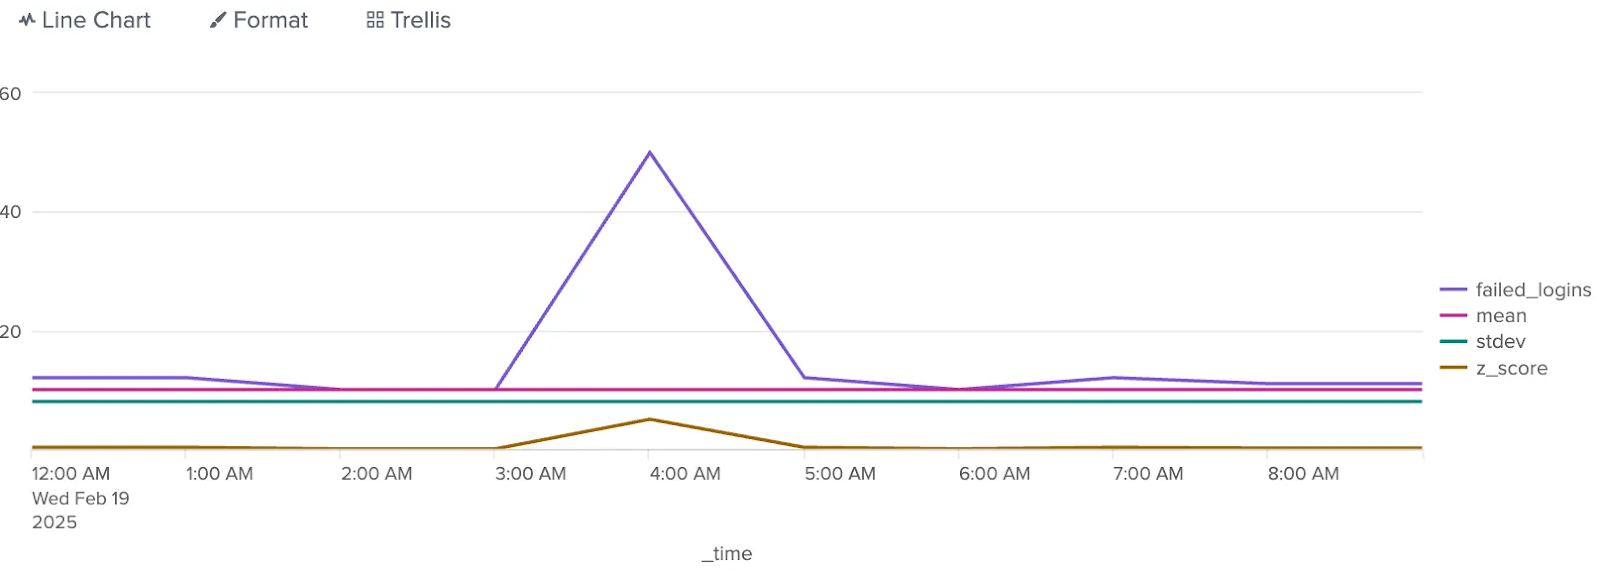
What this tells us:
50 failed logins in an hour when the average is 10? Ok, it definitely wasn’t me.
Use Case 3: Network Traffic—Detecting Data Exfiltration
Large outbound data transfers can signal exfiltration. Let’s find anomalies in outbound traffic volume.
index=thrunt sourcetype=firewall_logs direction=outbound

| bucket _time span=1h

| stats sum(bytes_out) as total_bytes by _time

| eventstats avg(total_bytes) as mean stdev(total_bytes) as stdev

| eval upper_bound = mean + (3 * stdev)

| eval lower_bound = mean - (3 * stdev)

| eval z_score = (total_bytes - mean) / stdev

| table _time z_score
Example output:

What this tells us:
See those Z-score spikes?! 👀 That’s not someone uploading thrunting memes.
Use Case 4: DNS Requests—C2 Beaconing Detection
Let’s look into a more subtle one. Anomalous DNS lookups can signal command-and-control (C2) activity.
index=thrunt sourcetype=dns_logs

| bucket _time span=10m

| stats count as dns_requests by _time

| eventstats avg(dns_requests) as mean stdev(dns_requests) as stdev

| eval z_score = (dns_requests - mean) / stdev
Example output:
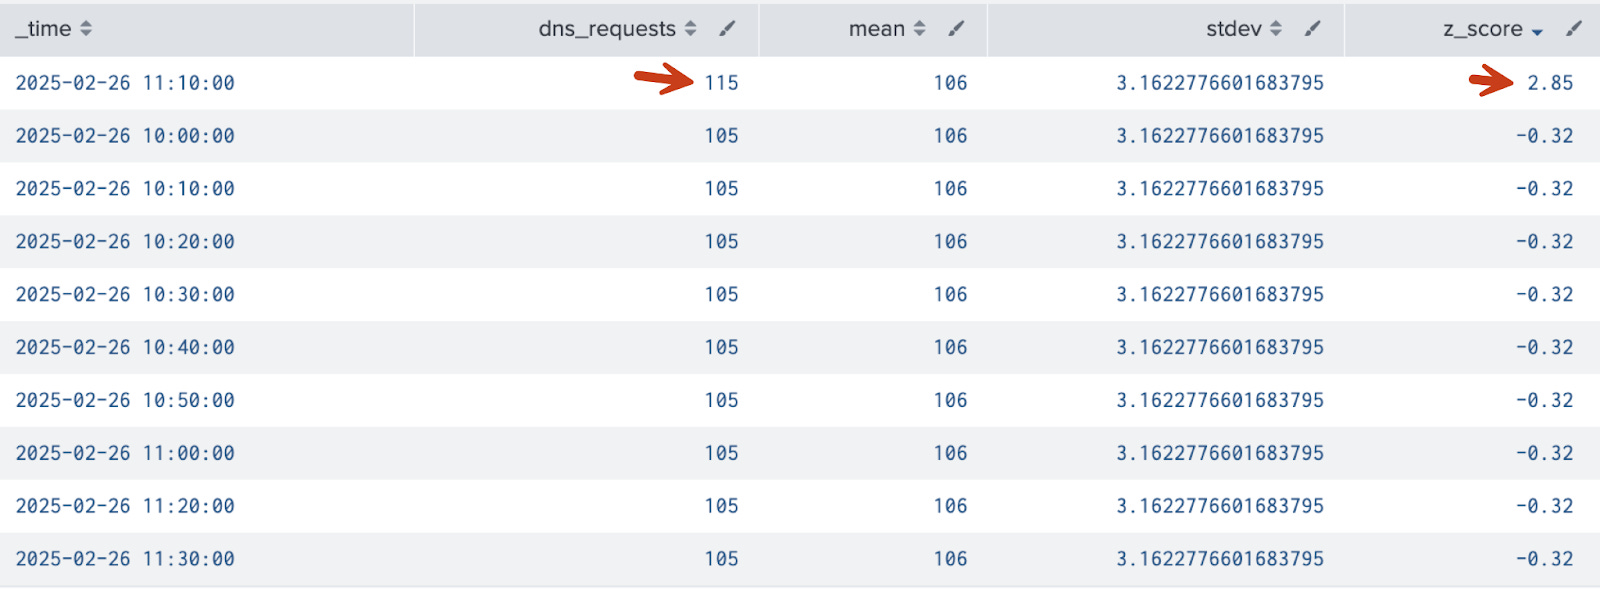

What this tells us:
Small spike in requests in 10 minutes? Seems like nothing, but the z-score says “hey, check this one out!” Z-scores can really help when we are trying to catch those subtle anomalies that other techniques might miss out on.
When to Use What: IQR vs. Standard Deviation vs. Z-Score
For a refresher on IQR, read my other post here.

Key Takeaways:
Standard deviation tells you how chaotic (or chill) your data is.
Z-scores help you spot anomalies, even when “normal” keeps moving.
Both are powerful tools for finding weirdness over time.
Math doesn’t have to be painful.
Your Turn:

Run these queries. Find the weird. Embrace the chaos.
Bonus points for the wildest Z-score you can find.
Stay curious and happy thrunting!

No mathletes were harmed in the making of these queries.