
Every Event for Itself…Until You Run eventstats
SPL Dispatch #2 - 05/13/2025

Welcome to SPL Dispatch, our series highlighting a single Splunk command per post, explaining why it matters for threat hunting and how to use it effectively. This time, we’re focusing on a deceptively simple but wildly powerful command: eventstats.
Why eventstats?
Sometimes, the best hunts are based on comparisons. You’re looking for something that stands out, but to know what’s weird, you need to know what’s normal in the first place. That’s where eventstats shines.
It lets you compute stats across the entire dataset and attach those values back to each event. This is huge when you want to flag events that deviate from the average, exceed a threshold, or otherwise "stand out" within their context.
How It Works

eventstats runs just like stats, but instead of rolling everything up into a table, it appends the aggregated value to each event.
Let’s say you want to flag source IPs generating significantly more network traffic than their peers…maybe scanning, beaconing, or just being unusually noisy.
index=thrunt sourcetype=stream:ip

| eventstats count by src_ip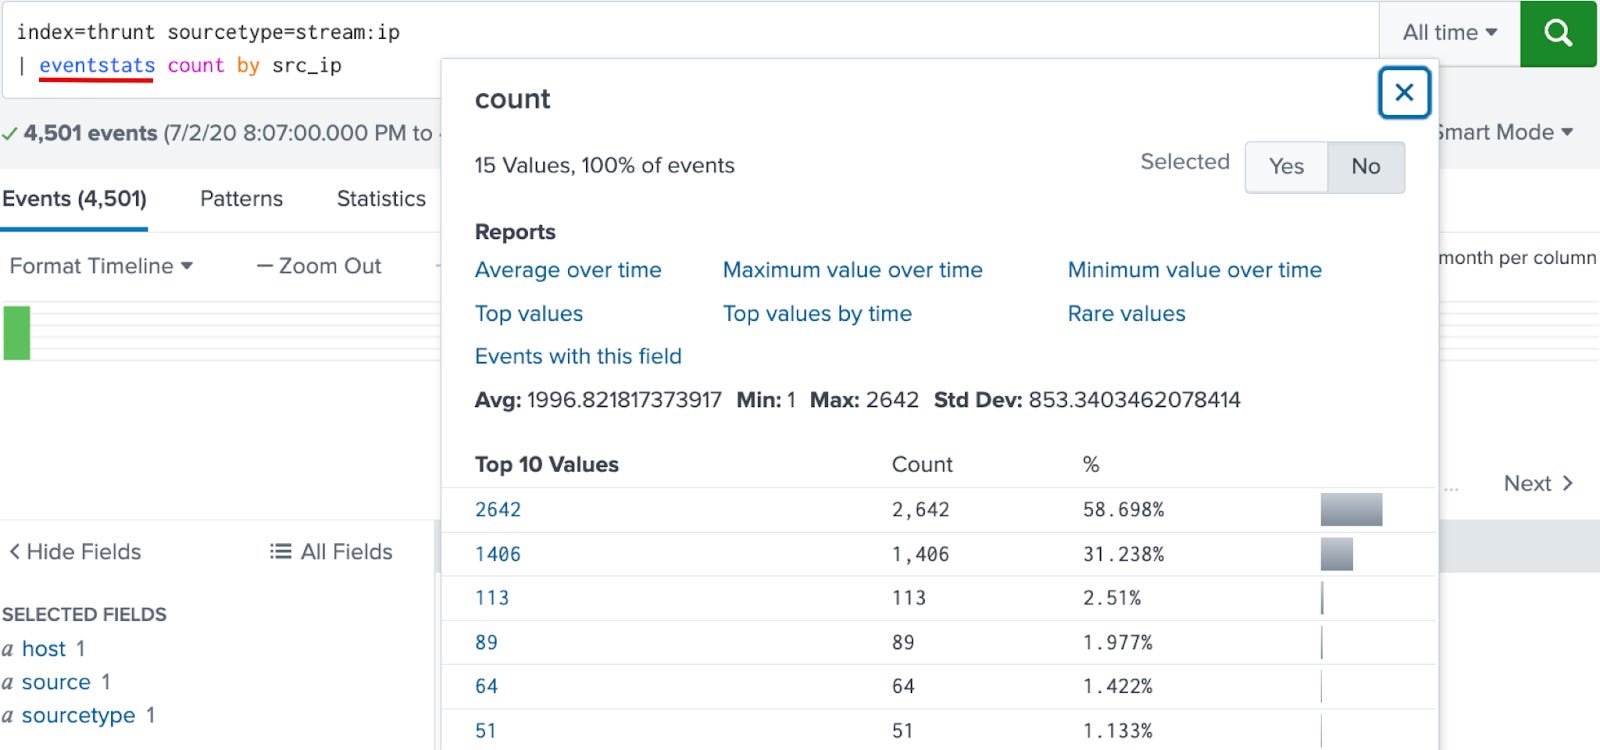
This approach keeps all your original data intact but adds the total count per src_ip to each event for easy comparison.
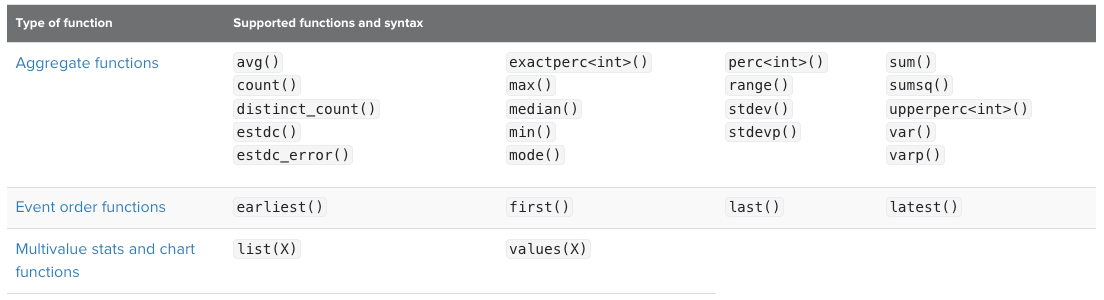
Since eventstats is a charting command, it supports all types of functions:
Hmm…remind me. What does stats look like again?
Let me refresh you with a similar query using stats:
index=thrunt sourcetype=stream:ip

| stats count by src_ip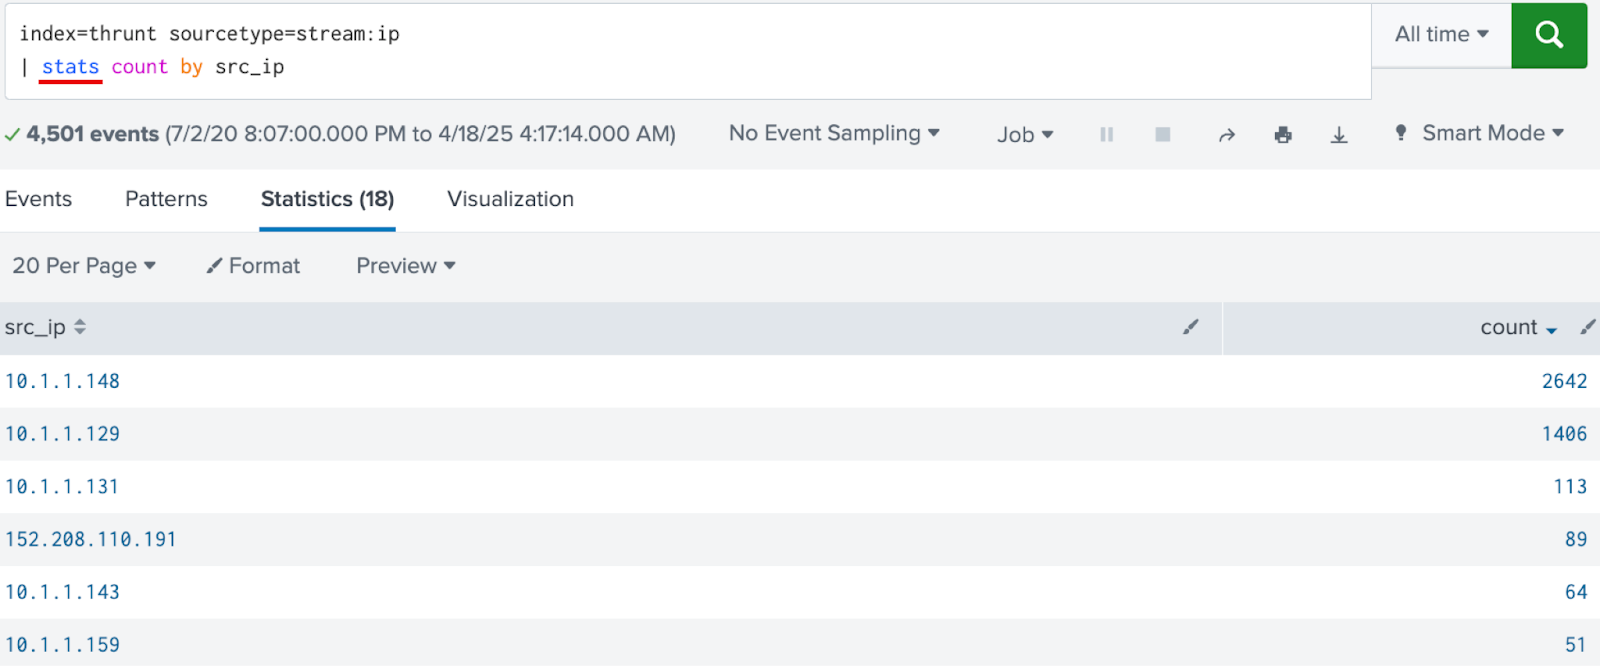
Here we see the pretty stats table only, none of that raw event data.
When to Reach for eventstats
Use eventstats when:
You want context embedded in each event
You’re comparing each row against a group summary
You want to flag anomalies without aggregating everything
It’s especially handy for:
Lateral movement hunts (e.g., unusual volume of logins to endpoints)
Beaconing detection (e.g., timing patterns relative to averages)
Insider threat behavior (e.g., one user uploads more data than their department)
Example Hunt Queries
DNS Beaconing
Let’s show the power of using eventstats to detect DNS queries from the same source IP to the same domain at consistent intervals. Hint…hint….beaconing?
index=thrunt sourcetype=stream:dns

| bin _time span=1m

| stats count as queries_per_min by src_ip query _time

| eventstats count as total_intervals, avg(queries_per_min) as avg_qpm, min(queries_per_min) as min_qpm, max(queries_per_min) as max_qpm by src_ip query

| where total_intervals >= 5 AND max_qpm - min_qpm < 5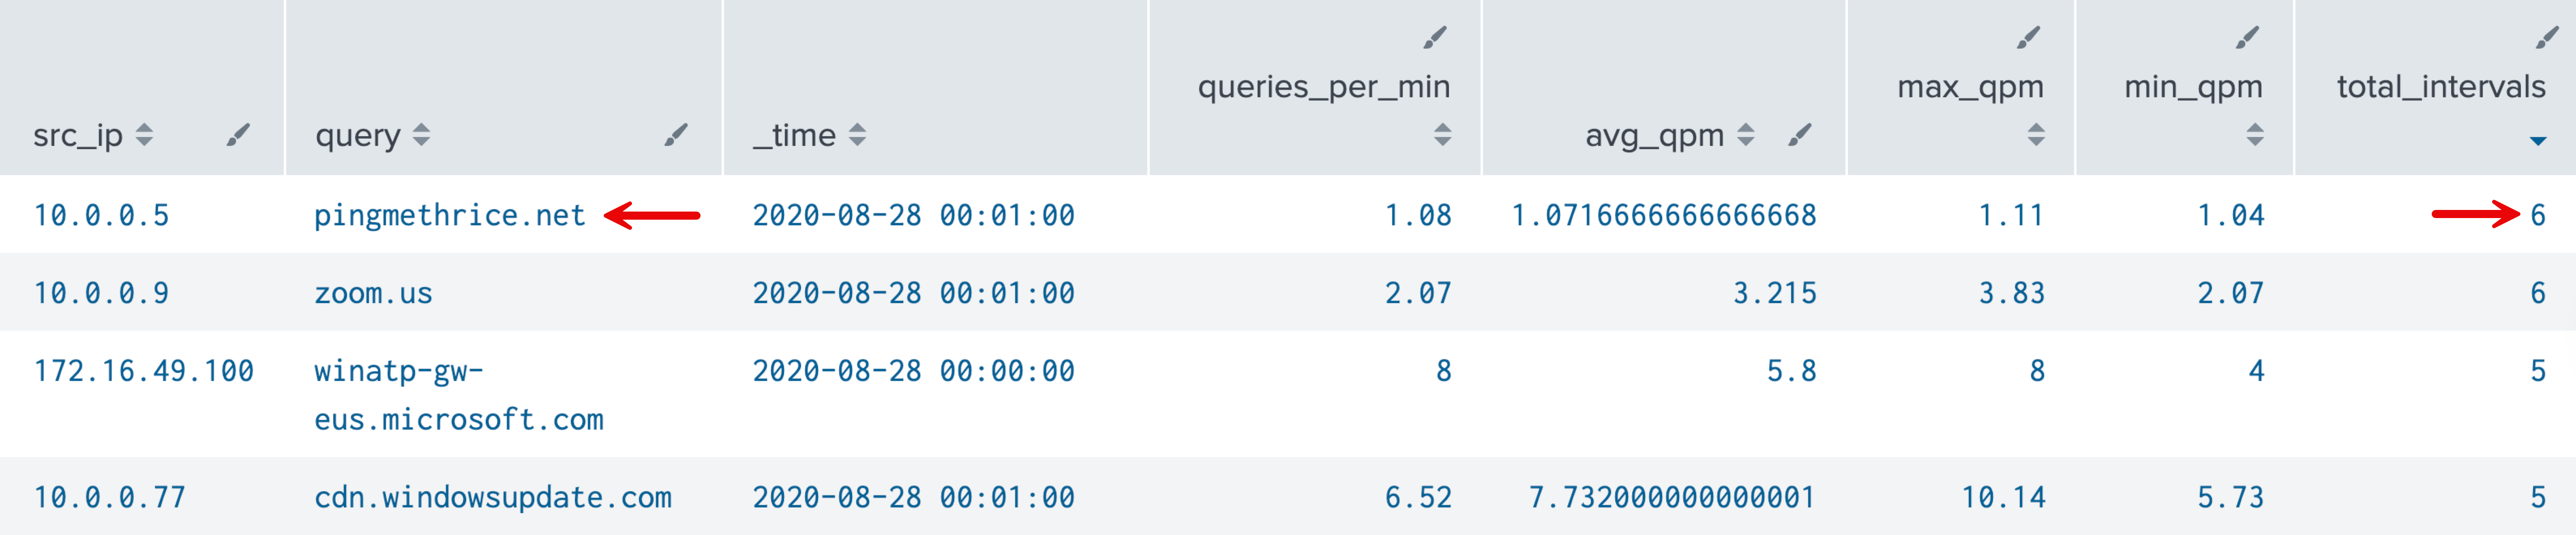
What It Does
bin: groups events into 1-minute buckets
stats: counts DNS queries per IP/domain combo per minute
eventstats: adds overall behavior stats (like min/max/avg query volume) back onto every 1-minute interval, so you get both zoomed-in and zoomed-out views—together
Final where: flags IPs querying a domain with consistent volume across multiple intervals.
Why is this cool? Unlike stats, eventstats lets you keep per-minute visibility while still calculating overall behavior. Voilà. That’s the magic of eventstats.
Proxy Uploads
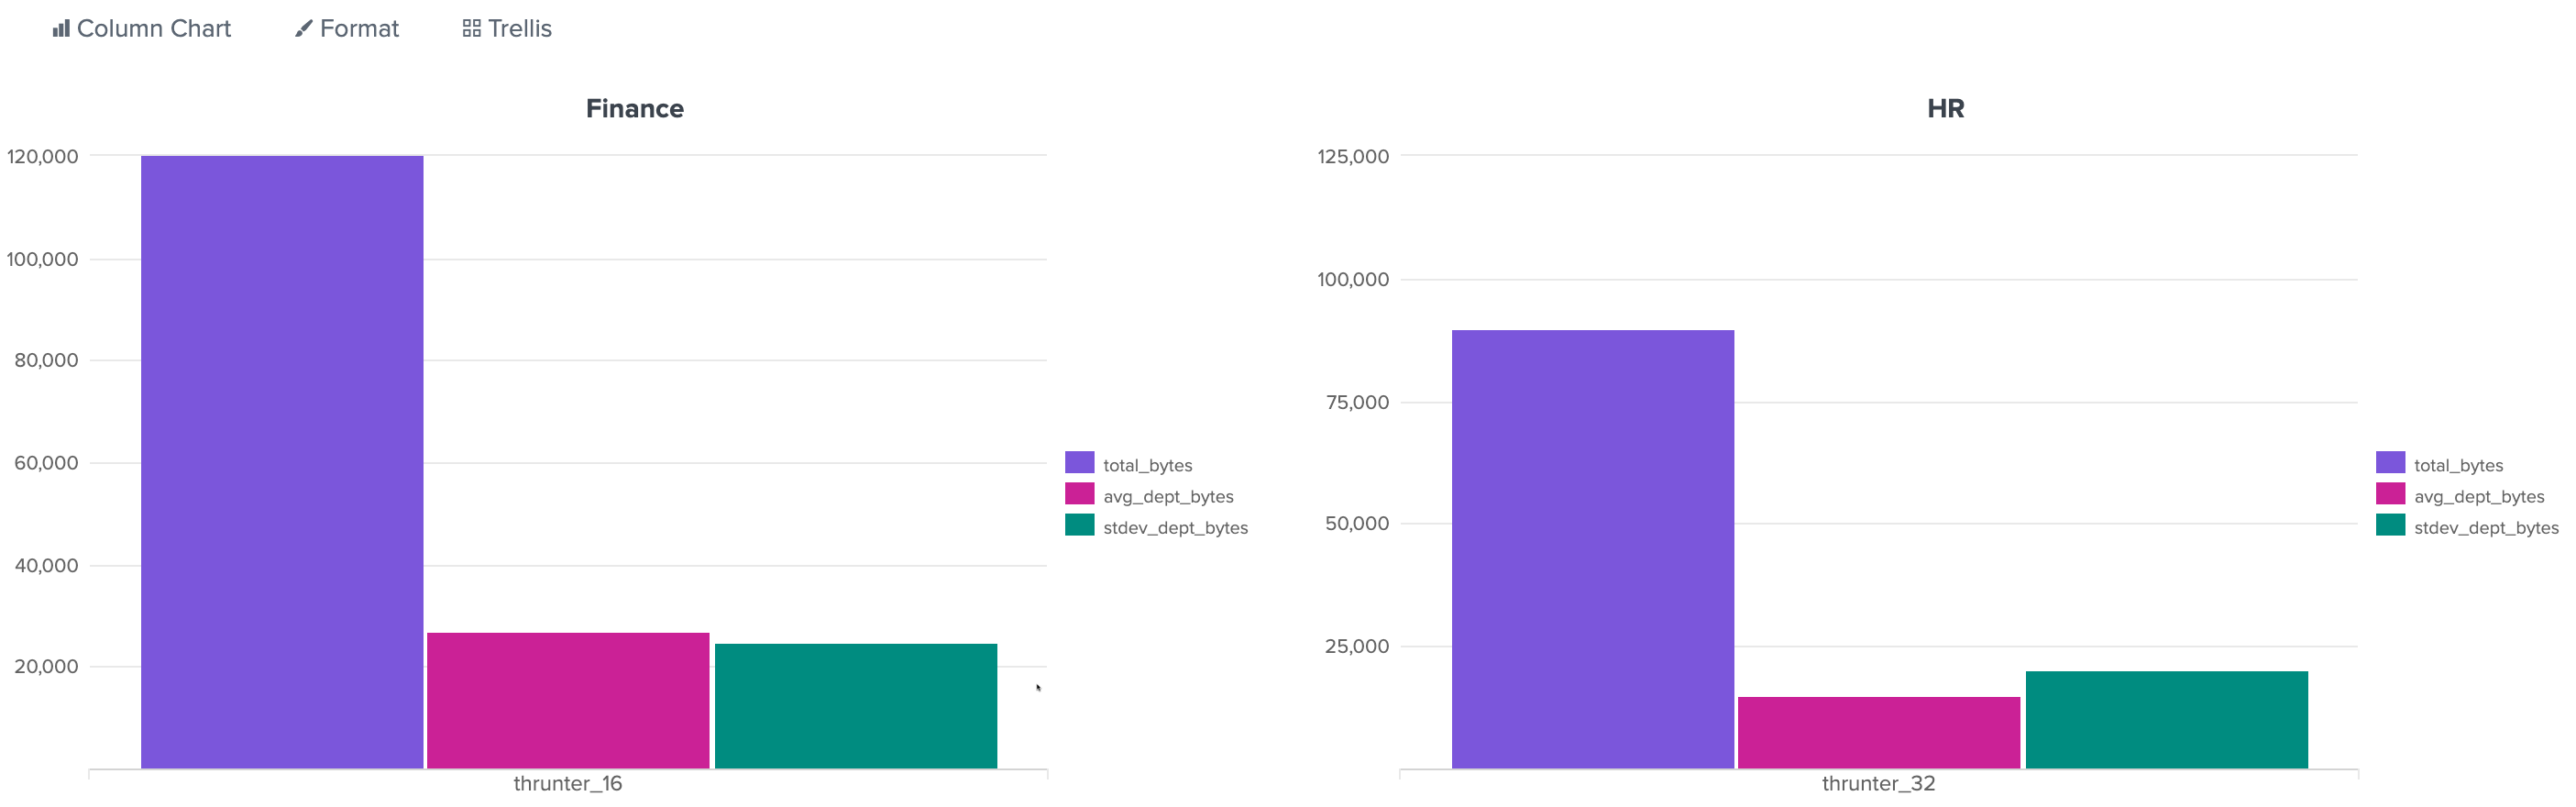
Let’s say you want to find users transferring significantly more data than others in their department or team (or even all users). This is a classic insider threat behavior: one user uploads or downloads way more than their peers. Let’s sprinkle in a little standard deviation too (check my previous post for a refresher).
index=thrunt sourcetype=proxy action=upload

| stats sum(bytes_out) as total_bytes by user, department

| eventstats avg(total_bytes) as avg_dept_bytes, stdev(total_bytes) as stdev_dept_bytes by department

| where total_bytes > avg_dept_bytes + (3 * stdev_dept_bytes)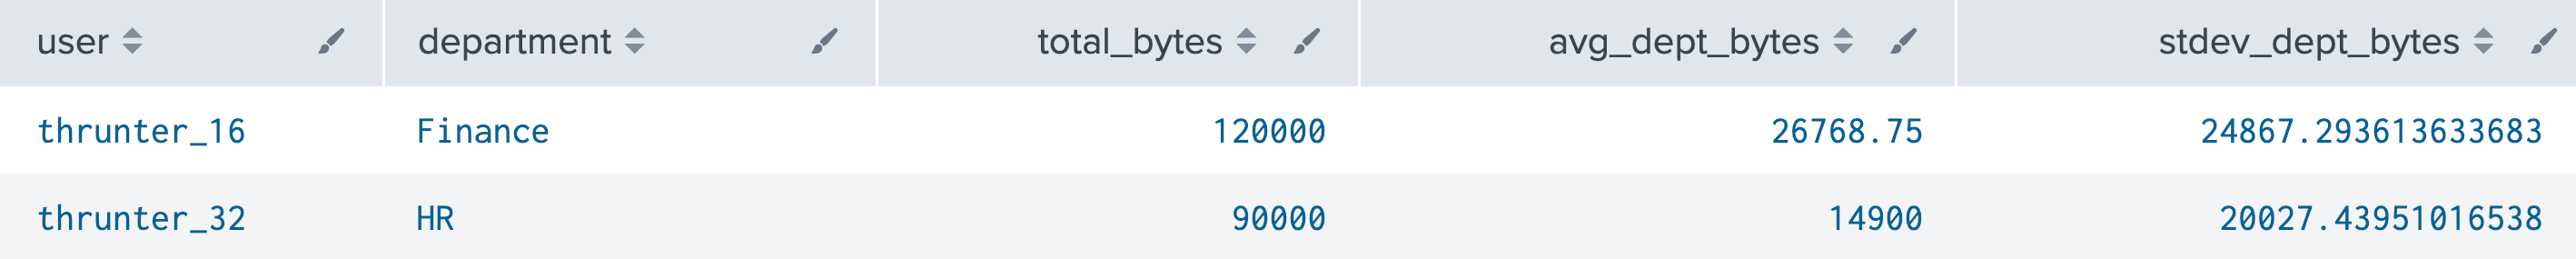
What It Does
stats: totals data exfil per usereventstats: computes the department average and standard deviationwhere: flags users whose usage is >3 standard deviations above the mean (statistical anomaly)
Thrunter Tips
Unlike stats, you don’t lose your raw events. So you can preserve details for deeper triage.
eventstats can balloon your result size. So keep your group-by fields minimal and meaningful.
Combine eventstats with streamstats (maybe a future post?) for some creative sequential logic (think: relative comparisons over time).
Be careful not to overload your search with too many group-by fields, keep it purposeful.
Useful Resources
Z-Scoring Your Way to Better Threat Detection (my previous post has A LOT of great eventstats examples)
Using stats, eventstats & streamstats for Threat Hunting…Stat!
Final Thought
Hunting is about pattern recognition, but you can’t recognize patterns without context. eventstats gives you just enough summary to power smart, precise detection logic without washing out the juicy details (aka the events).
It’s every event for itself… until eventstats rolls in with receipts and group context.
Happy thrunting!
Excellent article! Minor nit: stdev() only works the way you want if the data being measured follows a normal distribution over the interval (i.e. bell curve). That's generally very rare in log data. Try percentile() and use boxplot-whisker calculations for anomaly detection. (e.g. 75th + (1.5 * ( 75th - 25th ))).